In its last meeting during 5-6 December 2019, OPEC (Organization of the Petroleum Exporting Countries) members and non-OPEC countries had decided to cut oil production by additional 500,000 barrels per day (in addition to existing cuts of 1.2 million bpd already in place) aiming to comfort the oversupplied oil market and to support the prices. The oil producers decided to meet again in March 2020 to evaluate whether these cuts have worked or not and to explore the next course of action, if any. However, there are now talks of a meeting this month to evaluate the impact of the novel coronavirus on oil demand and to decide the course of action for oil supplies this year.
In the light of these events, it would be interesting to examine whether oil prices have actually moved higher whenever oil production was reduced. Similarly, have oil prices actually moved down whenever oil production was increased. This article explores historical efficacy of OPEC decisions.
OPEC history
Before we move further, we find it suitable to present OPEC’s history in brief. OPEC was established with the initial efforts coming in from Venezuela and Iran in 1949 that later roped in Iraq, Kuwait and Saudi Arabia. Their objective was to start, improve and continue conversation over oil and oil-related exports. Back then, the US was the largest producer and the largest consumer of oil and the world oil market was dominated by and influenced by the “ Seven Sisters” (due to their control of most of the world’s oil reserves). The “Seven Sisters” were oil companies based in either the USA or the UK that, with their political influence and vertical integration, could negotiate as a cartel and exert great influence on the world oil market. With efforts of the founding five, OPEC was established in 1960 and it came into effect from 1961. This resulted in transfer of control of oil reserves from private companies to state-owned companies i.e. from private hands to governments since OPEC member countries operated through state-owned companies and they could now dictate, as a cartel, the prices to the market by tweaking oil production.
The stated mission of OPEC is to “coordinate and unify the petroleum policies of its Member Countries and ensure the stabilization of oil markets, in order to secure an efficient, economic and regular supply of petroleum to consumers, a steady income to producers, and a fair return on capital for those investing in the petroleum industry”. Today, OPEC has 14-member countries accounting for close to half of world’s oil production and more than 3/4th of world’s proven oil reserves. Gradually, the rising non-OPEC oil production, especially in the USA, has again started challenging the dominant role of OPEC just as OPEC challenged the “Seven Sisters” in 1960s and 1970s.
For our purpose, we divide the history of OPEC production decisions in 3 parts. First, from 1961 to 1998 when oil futures prices were either not available or were not liquid enough; second, from 1998 to 2003 covering approximately 50% of OPEC decisions taken between 1998 and 2019; and third, from 2004 till now covering the remaining 50% of OPEC decisions taken between 1998 and 2019. We use ICE Brent futures weekly settlement prices as the proxy for oil prices.
1961 to 1998 period
During the 1961 to 1998 period, there was generally very high correlation between OPEC decisions and the oil prices since oil prices were not as actively traded as today. Therefore, we simply provide a rundown of the decisions that were taken and it can be implied that the prices mostly moved in the opposite direction as per the expectations.
The first potential influence of an OPEC decision came in 1967 during the Six-Day War between Israel and Arab countries. However, the oil embargo was not cohesively planned and executed, resulting in hardly any influence on prices.
The next event was the Yom Kippur War during 1973-1974 between Israel and Arab countries. This time the oil embargo was better planned and well-coordinated resulting in a significant and immediate jump in oil prices. As per several estimates, the inflated-adjusted annual average of the 1973 oil prices was one of the highest until today. This reflected the significance of the embargo decision and cemented the role of OPEC as a price influencer. The 1973-1974 oil embargo showed to the world, for the first time, that oil could successfully be used as a political and economic weapon by OPEC member countries.
The next significant event resulting in an effective disruption in the oil supplies was in 1979-1980 due to the Iranian Revolution of 1979 and Iran-Iraq War that began in 1980. This crisis resulted in a faster commercial exploration and commissioning of major oil fields in non-OPEC countries. Due to the worldwide energy conservation efforts, these non-OPEC oil fields resulted in increased production facing falling demand.
Much before the glut of 1980s could affect oil prices; Saudi Arabia wanted to address the potential over-supply and requested other OPEC member countries to consider reducing or limiting their oil production. When no one seemed interested, Saudi Arabia cut its own oil production from 10 mbpd in 1979-1981 to just about 3.3 mbpd in 1985. Eventually, this also proved ineffective as the demand was falling in the face of rising non-OPEC production. As a result, to safeguard its revenues, Saudi Arabia flooded the market with its cheap oil, starting from 1986, taking prices below $10 and making higher cost producers unprofitable (something like the 2014-15 oil price crash). This was the lowest price for crude oil since 1973 and, in fact, until today.
Short-term disruptions during 1990 invasion of Kuwait (a two-day operation) caused prices to spike up immediately but as normalcy returned, prices started receding and continued moving down until 1998 due to the structural oversupply in the market. These low prices prompted OPEC to allocate production quota to its members regularly (not applied to Iraq) so that the oversupply could be controlled and the producers could fetch a better price. The quota system had been used earlier too but it was seriously followed only after prices in 1998 started moving towards the lows of 1990. This is one more reason, in this article, we look at the data before 1998 and after 1998 separately (see next section). Gradually, by the turn of the millennium, most OPEC members were accustomed to coordinated decisions and their streamlined implementation. As a result, the 9/11 attacks in 2001 and the US invasion of Iraq in 2003, despite being significant and disruptive events, didn’t cause much increase in oil prices as other OPEC members kept the market well supplied.
The period after 1998
First, we look at 1998 to 2003 period. This was a period when OPEC quotas were followed by the member countries and the prices were relatively stable. Beyond 2003, several events contributed to high volatility in oil prices and, therefore, it is best to look at the prices beyond 2003 separately. Very interestingly, of all the OPEC production decisions after 1998, about half such decisions took place during the 1998 to 2003 period i.e. the stable period and the remaining half took place after 2003 i.e. the volatile period.
The following graphs represent all OPEC decisions as well as movement in ICE Brent futures. The histograms represent the absolute changes in OPEC oil production in million barrels per day (mbpd), depicted on the right axis. The dots represent percentage change in oil prices depicted on the left axis.
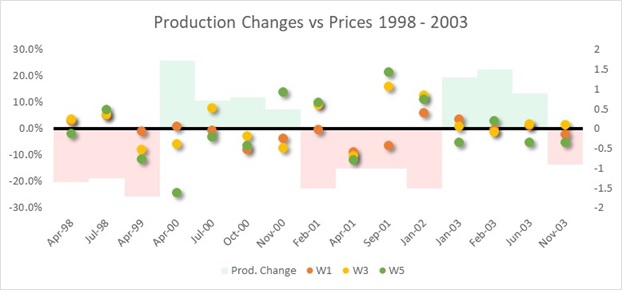
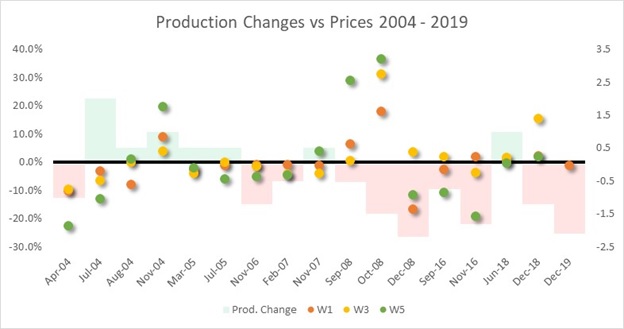
The light pink histograms represent a cut in the oil production and the light green histograms represent an increase in the oil production. The dots are progressive and indicate weekly total returns: the orange dots represent total percentage return 1-week after the OPEC decision, the yellow dots represent total percentage return 3-weeks after the OPEC decision, and the green dots represent total percentage return 5-weeks after the OPEC decision. Therefore, we can look at the movement from orange, yellow to green dots to understand how oil prices progressed every week after a particular OPEC production decision.
There are three ways we check this progression. We, first, check the returns relative to the corresponding OPEC decision. Second, we check the progression of returns from week 1 to week 5 to find out whether the movement continued in the same direction i.e. whether the conviction of the oil market strengthened or not after an OPEC decision. Third, we also check the relationship of returns with OPEC decisions on production cut and increase separately.
From the graphs, it is evident that all the production cut decisions were more or less similar in magnitude with average cut of 1.23 mbpd and standard deviation of 0.45 mbpd. Production increases deviated a little more with an increase of 0.96 mbpd and standard deviation of 0.50 mbpd. Theoretically, the relationship between the OPEC decision and oil price movement is negative. Graphically, this means, dots should never be on same side as histograms. In other words, both histograms and dots should not be positive or negative simultaneously. Following charts show the results of the aforementioned three checks.
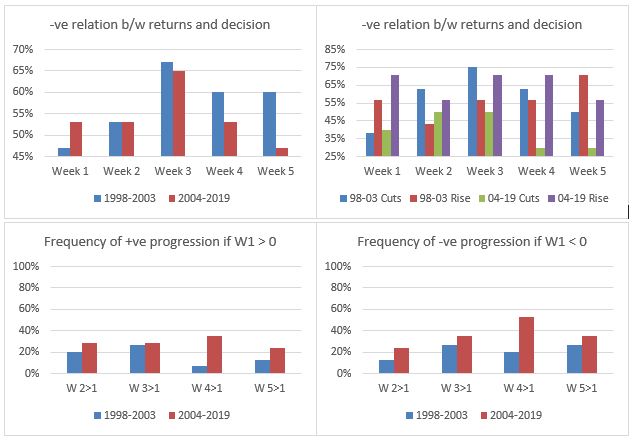
Here is a summary of our observations: –
1. Average performance of week 3 is the best.
2. When OPEC decides to cut production, prices seem to continue to slide even a week after the decision. However, when OPEC decides to increase production, there seems to be a bit higher probability of prices moving down.
3. If week 1 started positive irrespective of the OPEC production decision, the returns do not progress in the same direction. It is the case if week 1 started negative.
Conclusion
Though there are certain limitations to this study, for example, we have only focused on weekly returns, looked at point-to-point returns and have not considered other factors affecting oil prices. However, this study points out a remarkable observation. Either oil prices do not react the way as one would expect at least in the short-term or a catalyst with opposite effect emerges very near to OPEC decisions almost every time.
As per recommendations of the OPEC technical committee, OPEC members are more or less convinced of an additional cut of 600,000 barrels per day in the production. They are waiting for a confirmation from Russia, which might indicate its willingness anytime this week. Therefore, if this production cut is approved, our study suggests there is a better chance of prices moving up by the end of week 3.
Disclaimer
Opinions expressed in this blog belong solely to the individual authors and do not necessarily represent the opinion of Futures First Academy, its management and other group and associated companies. These opinions do not represent professional advice. Any action you take upon the information on this website is strictly at your own risk, and we will not be liable for any losses or damages in connection with the use of our website.