GDP Preview
Gross Domestic Product or GDP, as it is known in short, is the most comprehensive economic indicator for any economy that not only provides a yardstick to measure the performance of the economy in question but also a realistic scale using which such performance can be compared to the performance of other economies. Several other economic indicators use GDP for normalization in order to make such indicators comparable to similar indicators for any other economy.
As per the last release on 30 May, real GDP of USA in the first quarter of 2019 increased 3.1% annualized rate, as per a revised estimate known as the “second” estimate. The preliminary estimate, known as the “advance” estimate, had put that figure at 3.2% per annum. The downward revision (from 3.2% in the “advance” to 3.1% in the “second” estimate) was on account of nonresidential fixed investment and private inventory investment although exports and PCE had seen upward revisions. In the fourth quarter of 2018, GDP had increased by 2.2% annualized rate as per the “final” estimates. Next release is on 27 Jun. Below is the chart of annualized real GDP growth in USA for each quarter: –
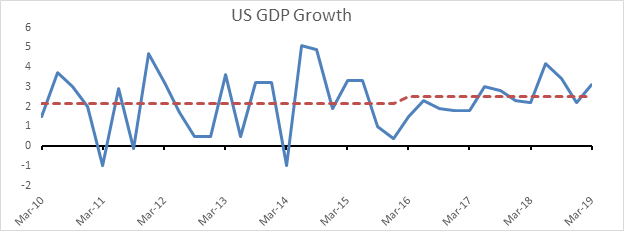
Since the Global Financial Crisis of 2008-2009, average annualized GDP growth rate has been 2.3% per annum. However, this dynamic has shifted for better in last 4 years. The average annualized GDP growth from 2010 to 2015 was 2.2% while the average beyond 2015 is 2.5% (red dotted lines in the above chart). In last 4 quarters, the growth has been above average and hence the economy was, as Fed had said repeatedly till last week’s FOMC meeting, growing “at a solid rate.” There is another appealing characteristic of GDP growth since 2016. Quarter 2 of each year has shown the highest growth compared to any other quarter for that year. While we need to wait another month for the “advance” estimate of quarter 2 figure for 2019; several experts already believe that number will be lower than the first quarter estimate for 2019. This is mostly due to the expectation of a drag from inventories.
GDP Components
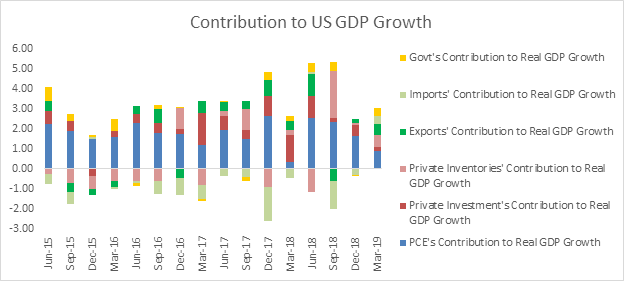
GDP has various components, namely: – consumption, investment, government expenditure and net exports. If needed, one can look at the break-up as well as several sub-parts of these components to gain better insight into what is contributing to GDP growth, what is not and what should. Following chart shows the contribution of these components to GDP growth: –
In light of this background, note that consumption or rather personal consumption expenditure (PCE), as it is technically known, is the most important component for a consumption-led economy such as US. It provides a strong base for the growth and keeps it sustainable. Following chart shows the contribution of PCE to US GDP growth rate: –
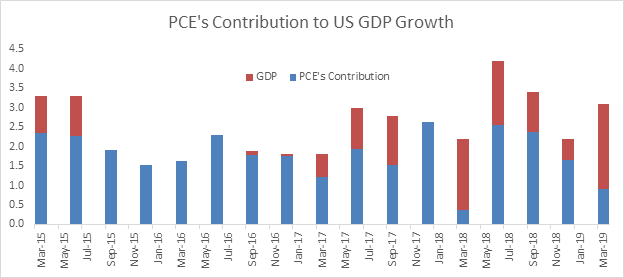
As per the last release, PCE’s contribution to GDP growth substantially reduced during Q1-2019. This is slightly troublesome and indicates that the GDP growth at this rate is not sustainable in long term till PCE starts contributing to it. So, what was it that contributed to GDP growth recently that earlier did not? The answer seems to lie in inventories and net exports.
In simple words, GDP effectively means production that may be looked at as being equivalent to the sum of sales and change in inventories. If inventories contribute to GDP growth that means sales is not contributing. In other words, production is growing but is not being sold. Instead, it’s getting stored for sale in future. Such buildup in inventories could be intended or unintended. Clearly, sustained contribution of inventories to GDP is not healthy for long run growth. It is equally important for sales to match up with production so as to keep inventories in check. In Q1-2019, change in inventories caused 60 basis points to GDP growth. This is quite high compared to the average contribution of inventories to GDP growth. Perhaps, this is why most GDP growth estimates for Q2-2019 expect a negative contribution from inventories. The “advance” estimate for Q2-2019 GDP growth will be release in Jul.
In Q1-2019, GDP growth also saw good contribution from net exports that was a result of a simultaneous increase in exports and decrease in imports. As a result, a good part of GDP growth looks sustainable. The worrisome part is the decrease in imports in light of an increase in PCE (a proxy for demand) and an increase in inventories. Generally, an increase in inventories should be due to reduction in demand, increase in imports or decrease in exports. In Q1-2019 GDP report, we saw none of that. Clearly, the increase in inventories was a surprise and will be closely watched for in the 27 Jun release and the Jul release.
Growth is very important today for USA as it provides the counterbalance to the “muted inflation pressures”. If growth dwindles or shows a potential to deteriorate in near future, Fed will have no choice but to cut rates and provide the necessary monetary policy impetus. Fed has also admitted in their recent FOMC meeting that the economic activity is now rising at a “moderate rate”. Earlier Fed had used the phrase “solid rate”. Any confirmation of the “moderate rate” of economic growth from the data releases will make a stronger case for Fed to cut rates sooner rather than later. This is especially true now that most FOMC members see a stronger case for a more accommodative policy.
Disclaimer
Opinions expressed in this blog belong solely to the individual authors and do not necessarily represent the opinion of Futures First Academy, its management and other group and associated companies. These opinions do not represent professional advice. Any action you take upon the information on this website is strictly at your own risk, and we will not be liable for any losses or damages in connection with the use of our website.