The Oct monthly labor report released by the ABS (Australian Bureau of Statistics) on Nov 14 recorded a headline well short of the market consensus. The report showed almost all the metrics slipping during the month of October. A single jobs report doesn’t really change the monetary policy landscape but there are some worrying emerging trends in the labor market. The RBA (Reserve Bank of Australia) has pegged a major part of their reaction function on the outcomes of the monthly labor reports. The odds of an RBArate cut happening in its December 2019 or February 2020 meeting have riled up a bit since the publishing of the last labor report. At the same time, it has posed some bigger questions on the economic recovery foreseen by RBA in the first half of 2020, something the RBA has reiterated in some of its recent communication.
As we posit in this article, the latest jobs report does not fall in line with the recent developments in the Australian labor market. Although, questions do arise regarding the sustainability of domestic job creation and subsequent effects on the wages. The headline unemployment rate could see a rebound in the 1Q 2020. At the same time, the rebound will most likely be not strong enough to bring the Australian economy close to the full employment levels or cause any meaningful rise in wages.
Why focus on the labor data?
The Reserve Bank Act, 1959 states ‘the maintenance of full employment in Australia’ as one of the three objectives of the Central bank. As the central bank has stated numerous times, the labor market is also central to achieving the third objective in the RBA mandate – the collective welfare.
Trends in the unemployment rate are also significantly important from an inflation standpoint. Both have shared a negative correlation historically, a prominent economic theory also known as the Philips Curve. Developments in the labor market thus make it to the center-frame of modern Central Banking.
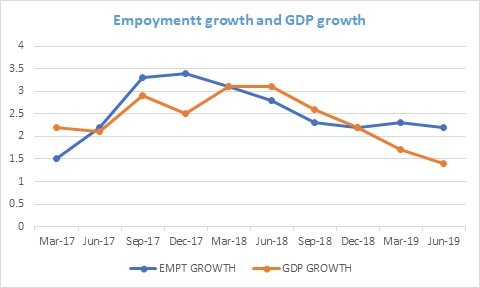
Something that may be worrying both the RBA and the markets is the stalling of the growth momentum on a rolling 3-month or 6-month basis. In fact, the momentum in the jobs market may just be weakening at a faster pace than what the RBA anticipated.
October labor report
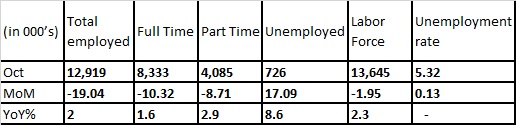
The October labor statistics, released by the ABS on Nov 14, showed that employment in the country fell by 19000 during the month, undershooting the market consensus of an increase by 15000 jobs by a huge margin. This more than erased the 12,500 increase in jobs in the month of September. The monthly figures also recorded an unfortunate rare combination that is both labor force participation rate going lower and unemployment rate ticking higher in the same month. The key statistics in the report are summarized in the table below: –
Does the report fall in line with the trend?
The monthly data point was in stark contrast to the solid jobs report numbers that have been recorded for most part of the last 3 years. The labor force participation rates currently sit at record highs, though the Australian economy still isn’t anywhere close to the full employment level as per RBA estimates.
It is important to stress upon the fact that there have been some structural shifts in the dynamics of labor market in the recent past.
On the other hand, Australian economy’s wage growth has been very sticky in nature throughout this entire episode. Bulk of the recent contribution in the Australian economy’s wage growth has come from the public sector, with the private sector lagging by some distance. At the same time, it is also important to point out that Australian labor enjoys one of the highest wages in the world (as per OECD data), a figure central to the nation’s prosperity.
It is evident that the sharp pace of employment creation that we have witnessed in the last few years is cooling off. The hiring momentum has stalled, firing up the odds of a prolonged slowdown in a weakening economy. This has broadly resonated with the slowdown in the Australian economy’s growth over the last few quarters. From the standpoint of RBA, this comes as a rude shock, as the labor market currently stands distant from the full employment levels and the lull in wage growth is becoming bigger with every passing quarter.
Much of the theory behind the relationship between unemployment rates and wage growth (“Philips curve”) rests upon the concept of labor-market slack, which invites more discussion at this point.
Labor market slack
In a very crude form, labor market slack, also known as the spare capacity in the labor market, is defined as the gap between the actual employment rate and the unemployment rate associated with full employment level in the economy (also known as NAIRU). Clearly, labor slack is not something directly quantifiable and is more of an estimate based on historical data.
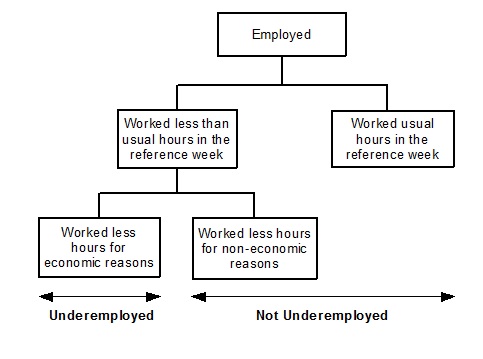
A complementary variable for gauging the labor slack is the underemployment rate, which measures the number of employed people who would like and are available to work additional hours, expressed as a share of the labor force. Traditionally, this rate has been higher among groups that have a higher share of part-time employment, such as females, younger workers and older workers.
Over the last 2½-3 years, growth in part-time employment has been particularly strong. Approximately 40% of the jobs created since the start of 2016 (i.e. post-mining boom era) have been part-time in nature.
At this point, it is important to point out that this balance tilting towards part-time employment shouldn’t be seen purely in a bad light. The arguments simply pointing to part-time jobs as bad jobs and full-time jobs as good jobs are flawed. In fact, Governor Lowe has often pointed out this accommodation of par-time workers into the labor market as one of the success stories of the Aussie labor market.
At the same time, latest ABS data shows around one fourth of the people working part-time not being satisfied with the hours they are offered and are willing to work more. As more people work part-time, it becomes common to be both employed and to work fewer hours than one wants to work. This helps explain why the unemployment rate has declined while the underemployment rate has stayed elevated during this period.
The underutilization rate (released by ABS) is another widely cited labor-slack metric that tries to combine both the concepts, i.e. both unemployed rate and underemployment rate. Although, it has a serious limitation of not considering that each unemployed person represents more potential hours of work than each underemployment worker (33 and 14 hours per week respectively, as per latest ABS data).
Supply side of the labor market
In the last few years, the employment creation in the country has been significantly outpacing the growth of the working age population. This had led to a considerable reduction in the unemployment rate. The supply of labor has increased in response to more demand for workers and is evident with the participation rate metric, which currently sits at a record 66%. The share of working age population in Australia with a job also peaks around the resources boom period.
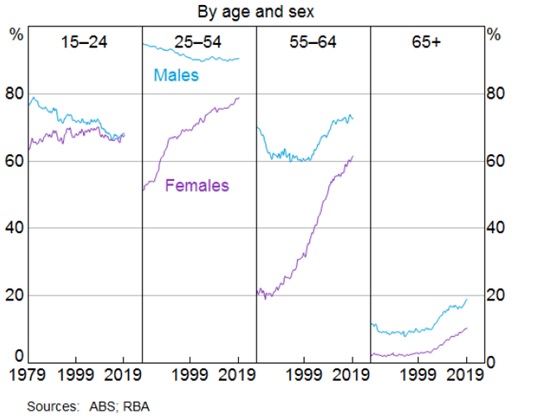
The two standout observations from the above chart are the meteoric rise in female participation rates in the 25-54 working age group and the rise in both male and female participation in the 55-64 age group.
Outlook for the next quarter
We expect the recent rebound in the unemployment rate to be temporary in nature. Going forward, we expect a pullback in the headline unemployment rate towards its recent lows of 5% in the first quarter of 2020. As per our previous discussion, it will remain at a sizeable distance from the RBA’s NAIRU estimates. Although there are some underlying trends emerging in the slack measures, but these owe mostly to the tectonic shifts happening in the internal dynamics of the labor market.
As per RBA’s standpoint, we don’t believe that the outcomes of the October jobs report will be able to force RBA for a cut in its December meeting. With much lesser monetary ammunition available and the full effects of prior rate cuts still to kick in, RBA would like to take account of the 3Q GDP report (to be released on December 4) and some more bit of economic data to be released. Although, we do believe that barring any strong rebound in economic indicators or global sentiments, a February 2020 RBA cut, at this point, looks pretty much on the cards.
Disclaimer
Opinions expressed in this blog belong solely to the individual authors and do not necessarily represent the opinion of Futures First Academy, its management and other group and associated companies. These opinions do not represent professional advice. Any action you take upon the information on this website is strictly at your own risk, and we will not be liable for any losses or damages in connection with the use of our website.